SAN BERNARDINO COUNTY RETAINS RELATIVELY LOW INCOME INEQUALITY
Income inequality, or the gap between the rich and the poor, has been increasing in the United States since the 1980s and is higher than most industrialized countries. High income inequality is associated with poorer public health, reduced socioeconomic mobility, and reduced feelings of well-being among those at the low end of the income distribution.[1] This indicator measures the level of income inequality among households in San Bernardino County using the Gini Index.
Gini Index Scale
Gini Index results range between zero (0) and one (1). A value of zero indicates complete equality, where all households have equal income. A value of one indicates complete inequality, where only one household has any income.
TREND
San Bernardino County’s Gini Index has remained mostly stable, decreasing only about 1% since 2018, from 0.439 in 2018 to 0.433 in 2023.
GEOGRAPHIC COMPARISON
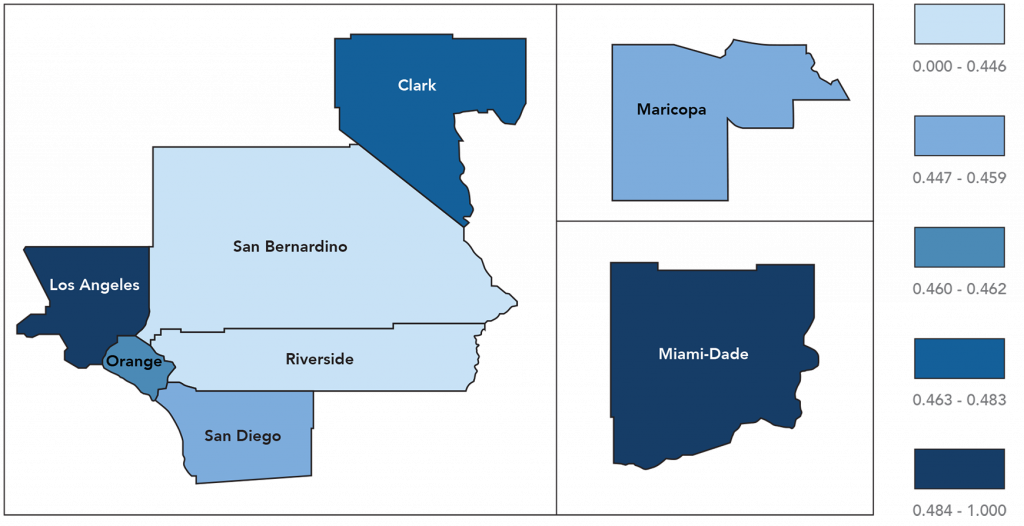
The San Bernardino County 2023 Gini Index score of 0.433 is lower than the California score (0.487) and the national average (0.483). Among the 42 California counties with populations of 65,000 or more, San Bernardino County has less income inequality than all but five counties (El Dorado, Kings, Stanislaus, San Benito, and Sutter). In comparison to selected peer and neighboring counties, San Bernardino County has the least income inequality.
LOWEST INCOME INEQUALITY AMONG COUNTIES COMPARED
County Comparison of the Gini Index of Income Inequality, 2023
INLAND EMPIRE NOTABLE FOR LOWEST INCOME INEQUALITY IN SOCAL REGION
County Comparison of the Gini Index of Income Inequality, 2023

Source: U.S. Census Bureau, American Community Survey, 1-Year Estimates (Table B19083)
[1] Reeves R. (2018). Restoring middle-class incomes: redistribution won’t do. Brookings Institute (www.brookings.com)
Organization for Economic Cooperation and Development (https://data.oecd.org/inequality/income-inequality.htm)
Pickett KE, Wilkinson, RG. (2015). Income inequality and health: A causal review. Social Science & Medicine. Vol.128
Oishi S, Kushlev K, et. al. (2018). Progressive Taxation, Income Inequality, and Happiness. American Psychologist, Vol.73(2)
Russell Sage Foundation. (2016). What we know about income inequality and social mobility in the United States (www.russellsage.org)