MANY RURAL COMMUNITIES LAG BEHIND FEDERAL BENCHMARK FOR CONNECTIVITY
As employment, education, healthcare, and government services increasingly move online, gaps in connectivity translate directly into gaps in opportunities. Tracking broadband availability and adoption in San Bernardino County communities reveals where county residents may be left behind, whether due to a lack of physical infrastructure or affordability barriers, and helps target investments where they are needed most. This indicator measures residential broadband availability according to federal criteria for the nation, state, county, and census tracts in San Bernardino County. For the same geographies, this indicator also measures broadband adoption, which is defined as a household opting to connect to an available service through an Internet service provider (ISP). Finally, the indicator introduces a broadband desert index crafted for the San Bernardino County context, combining the four measures of broadband access reported in this indicator, plus a measure of poverty, to provide an informal visual assessment of the variation in connectivity across cities and unincorporated communities in the county.
Understanding Broadband
The term “broadband” refers to high-speed Internet access that meets a minimum threshold, regardless of the technology used to deliver it. The threshold is based on how fast data can be uploaded and downloaded as measured in megabytes per second (Mbps). As of 2024, the Federal Communications Commission (FCC) defines the benchmark as 100 Mbps download / 20 Mbps upload for fixed broadband, such as DSL, cable, fiber optic, or satellite. Fixed broadband serves stationary units, like a residence or business. Fixed broadband can be further disaggregated as satellite (service provided by low orbit or geostationary satellites) or terrestrial (all wired or wireless connections that are not provided by satellite).
For mobile broadband, which serves a mobile device that is accessing a cellular network, a speed of 35 Mbps download and 3 Mbps upload is considered functionally analogous to the fixed broadband threshold, but the FCC does not have a formal benchmark for mobile speeds.
The Infrastructure Investment and Jobs Act of 2021 allocated $65 billion to expand high-speed Internet access and created the Broadband Access, Equity, and Deployment (BEAD) Program to allocate block grants to states based on levels of broadband access. A location is considered unserved if it has no access to broadband at all or if available service offers speeds below 25 Mbps download and 3 Mbps upload. Importantly, an area with only satellite service, regardless of speed, is usually considered unserved due to high latency (the time it takes data to make a roundtrip from a device to the server/cloud), slower than benchmark speeds, or both. A location is considered underserved if it is not in the unserved category but has connection speeds below the FCC benchmark of 100 Mbps download and 20 Mbps upload. A location is considered served if it has access to reliable terrestrial broadband service with speeds of at least 100 Mbps download and 20 Mbps upload and low levels of latency.
Source: FCC Fact Sheet: Inquiry Concerning Deployment of Advanced Telecommunications Capability to All Americans in a Reasonable and Timely Fashion, 2024 Section 706 Report, GN Docket No. 22-270, February 22, 2024 (https://docs.fcc.gov/public/attachments/DOC-400675A1.pdf); GovFacts, The National Broadband Map: A Picture of Internet Availability, July 21, 2025, https://govfacts.org (retrieved March 24, 2026)
TREND
Availability
As of June 2025, 93.0% of residential buildings in the county had access to terrestrial broadband at or above the minimum speed threshold (100 Mbps download / 20 Mbps upload).[1] This means that 93.0% of households could have high-speed non-satellite, non-mobile Internet access if they chose to subscribe to the service. This rate is 2.6 percentage points higher than in December 2023, when 90.4% of residential buildings had terrestrial broadband availability at or above the FCC benchmark.
Availability declines to 90.4% at the next highest speed threshold (250/25 Mbps) and further to 50.0% having access to speeds of at least 1000/100 Mbps as of June 2025. Since December 2023, there has been gradual improvement in broadband availability at these higher speeds.
INCREMENTAL ANNUAL IMPROVEMENT IN AVAILABILITY OF TERRESTRIAL BROADBAND
Percentage of Residential Buildings that have Terrestrial Broadband Service Available at Speeds at or above the FCC Benchmark (100/20 Mbps), December 2023 – June 2025
Adoption
In 2024, approximately 72.1% of San Bernardino County households had a subscription to Internet service that approximates the FCC benchmark – a non-mobile, non-satellite Internet subscription.[2] This represents an increase since 2020 when 67.0% of households had an FCC benchmark-like subscription. Households with any type of Internet service (e.g., wired, wireless, satellite, mobile, etc.) rose from 87.5% of all county households in 2020 to 93.3% in 2024. The percentage of households that have only a cellular data plan and no other type of Internet service remained relatively flat over the five-year period, remaining in the 11% to 12% range. Similarly, satellite Internet subscriptions have remained in the 9% to 10% range.
GRADUAL IMPROVEMENT IN PERCENTAGE OF HOUSEHOLDS WITH AN INTERNET SUBSCRIPTION OF SOME KIND
Percentage of Households with Selected Internet Subscription Types in San Bernardino County, 2020 – 2024
Mobile Data Plan Adoption
High-speed mobile coverage, which can be helpful to rural residents when wired service is not available, is available to 60.3% of San Bernardino County. In terms of mobile service adoption, 88.3% of households have a cellular data plan subscription and 11.7% of households have a cellular data plan subscription and no other type of internet subscription.
GEOGRAPHIC COMPARISON
Availability
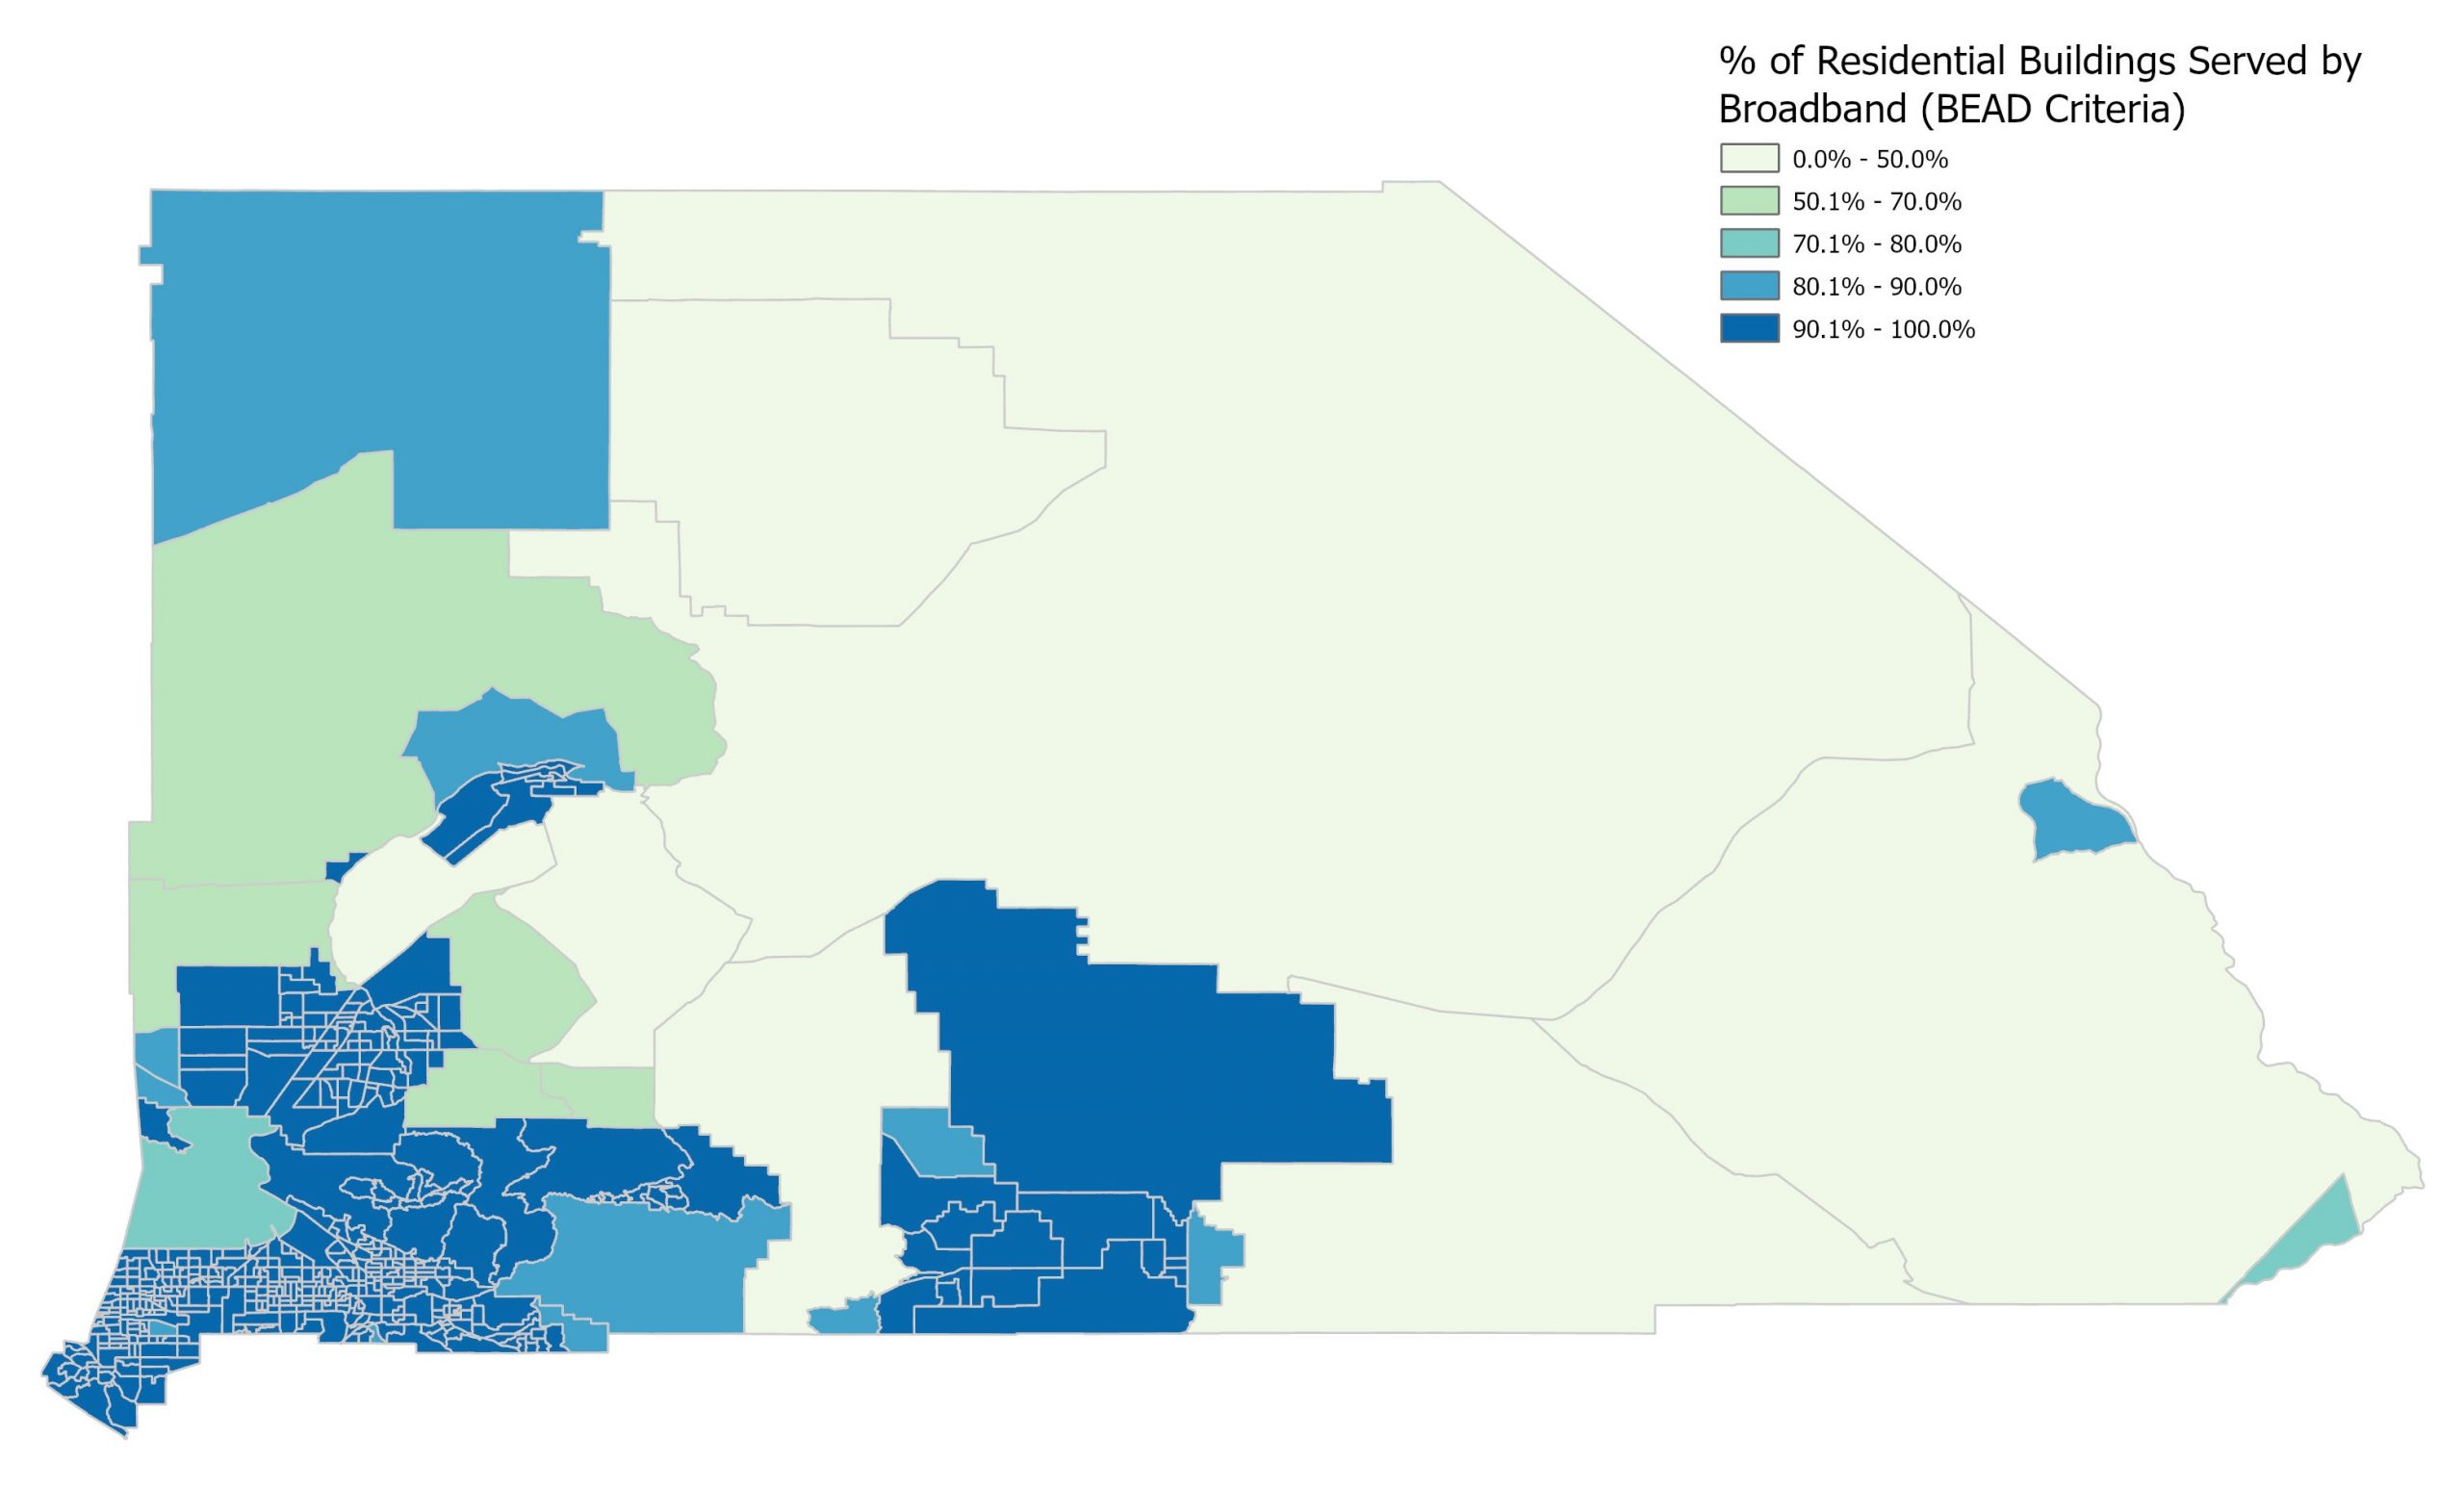
High-speed terrestrial residential Internet availability in San Bernardino County as of June 2025 (93.0%) was somewhat lower than state and national figures, at 96.4% and 95.1%, respectively. However, variation grows at the local level. The following map uses the BEAD criteria to assess the level of broadband availability at residential buildings in each census tract. In the areas shaded the lightest color, only 50% or fewer residential buildings have high-speed terrestrial Internet, including small pockets of lower availability in the Valley and Mountain regions, and large areas of lower availability in the North and East Desert regions. The darkest shade represents areas where more than 90% of residential buildings have broadband availability.
NORTH AND EAST DESERT REGIONS HAVE SEVERAL RURAL AREAS WITH LOW-TO-MODERATE BROADBAND AVAILABILITY
Percentage of Residential Buildings that have High-Speed Terrestrial Broadband Service Based on BEAD Eligibility Criteria by Census Tract, June 2025
Source: Federal Communications Commission, National Broadband Data Collection, June 30, 2025
Adoption
San Bernardino County’s rurality likely contributes to having slightly lower levels of Internet subscriptions that approximate the FCC benchmark (72.1%) than the state (74.7%) and nation (72.9%). Rurality also likely contributes to higher cellular-only and satellite subscribers than the state and nation. The percentage of San Bernardino County residents with an Internet subscription of any kind (93.4%) is just under the state rate (93.6%) and slightly above the national rate (91.1%).
COUNTY RESIDENTS ARE SLIGHTLY MORE LIKELY THAN THE STATE AND NATION TO HAVE SATELLITE OR MOBILE-ONLY INTERNET SUBSCRIPTIONS
Percentage of Households with Selected Internet Subscription Arrangements for the United States, California, and San Bernardino County, 2024
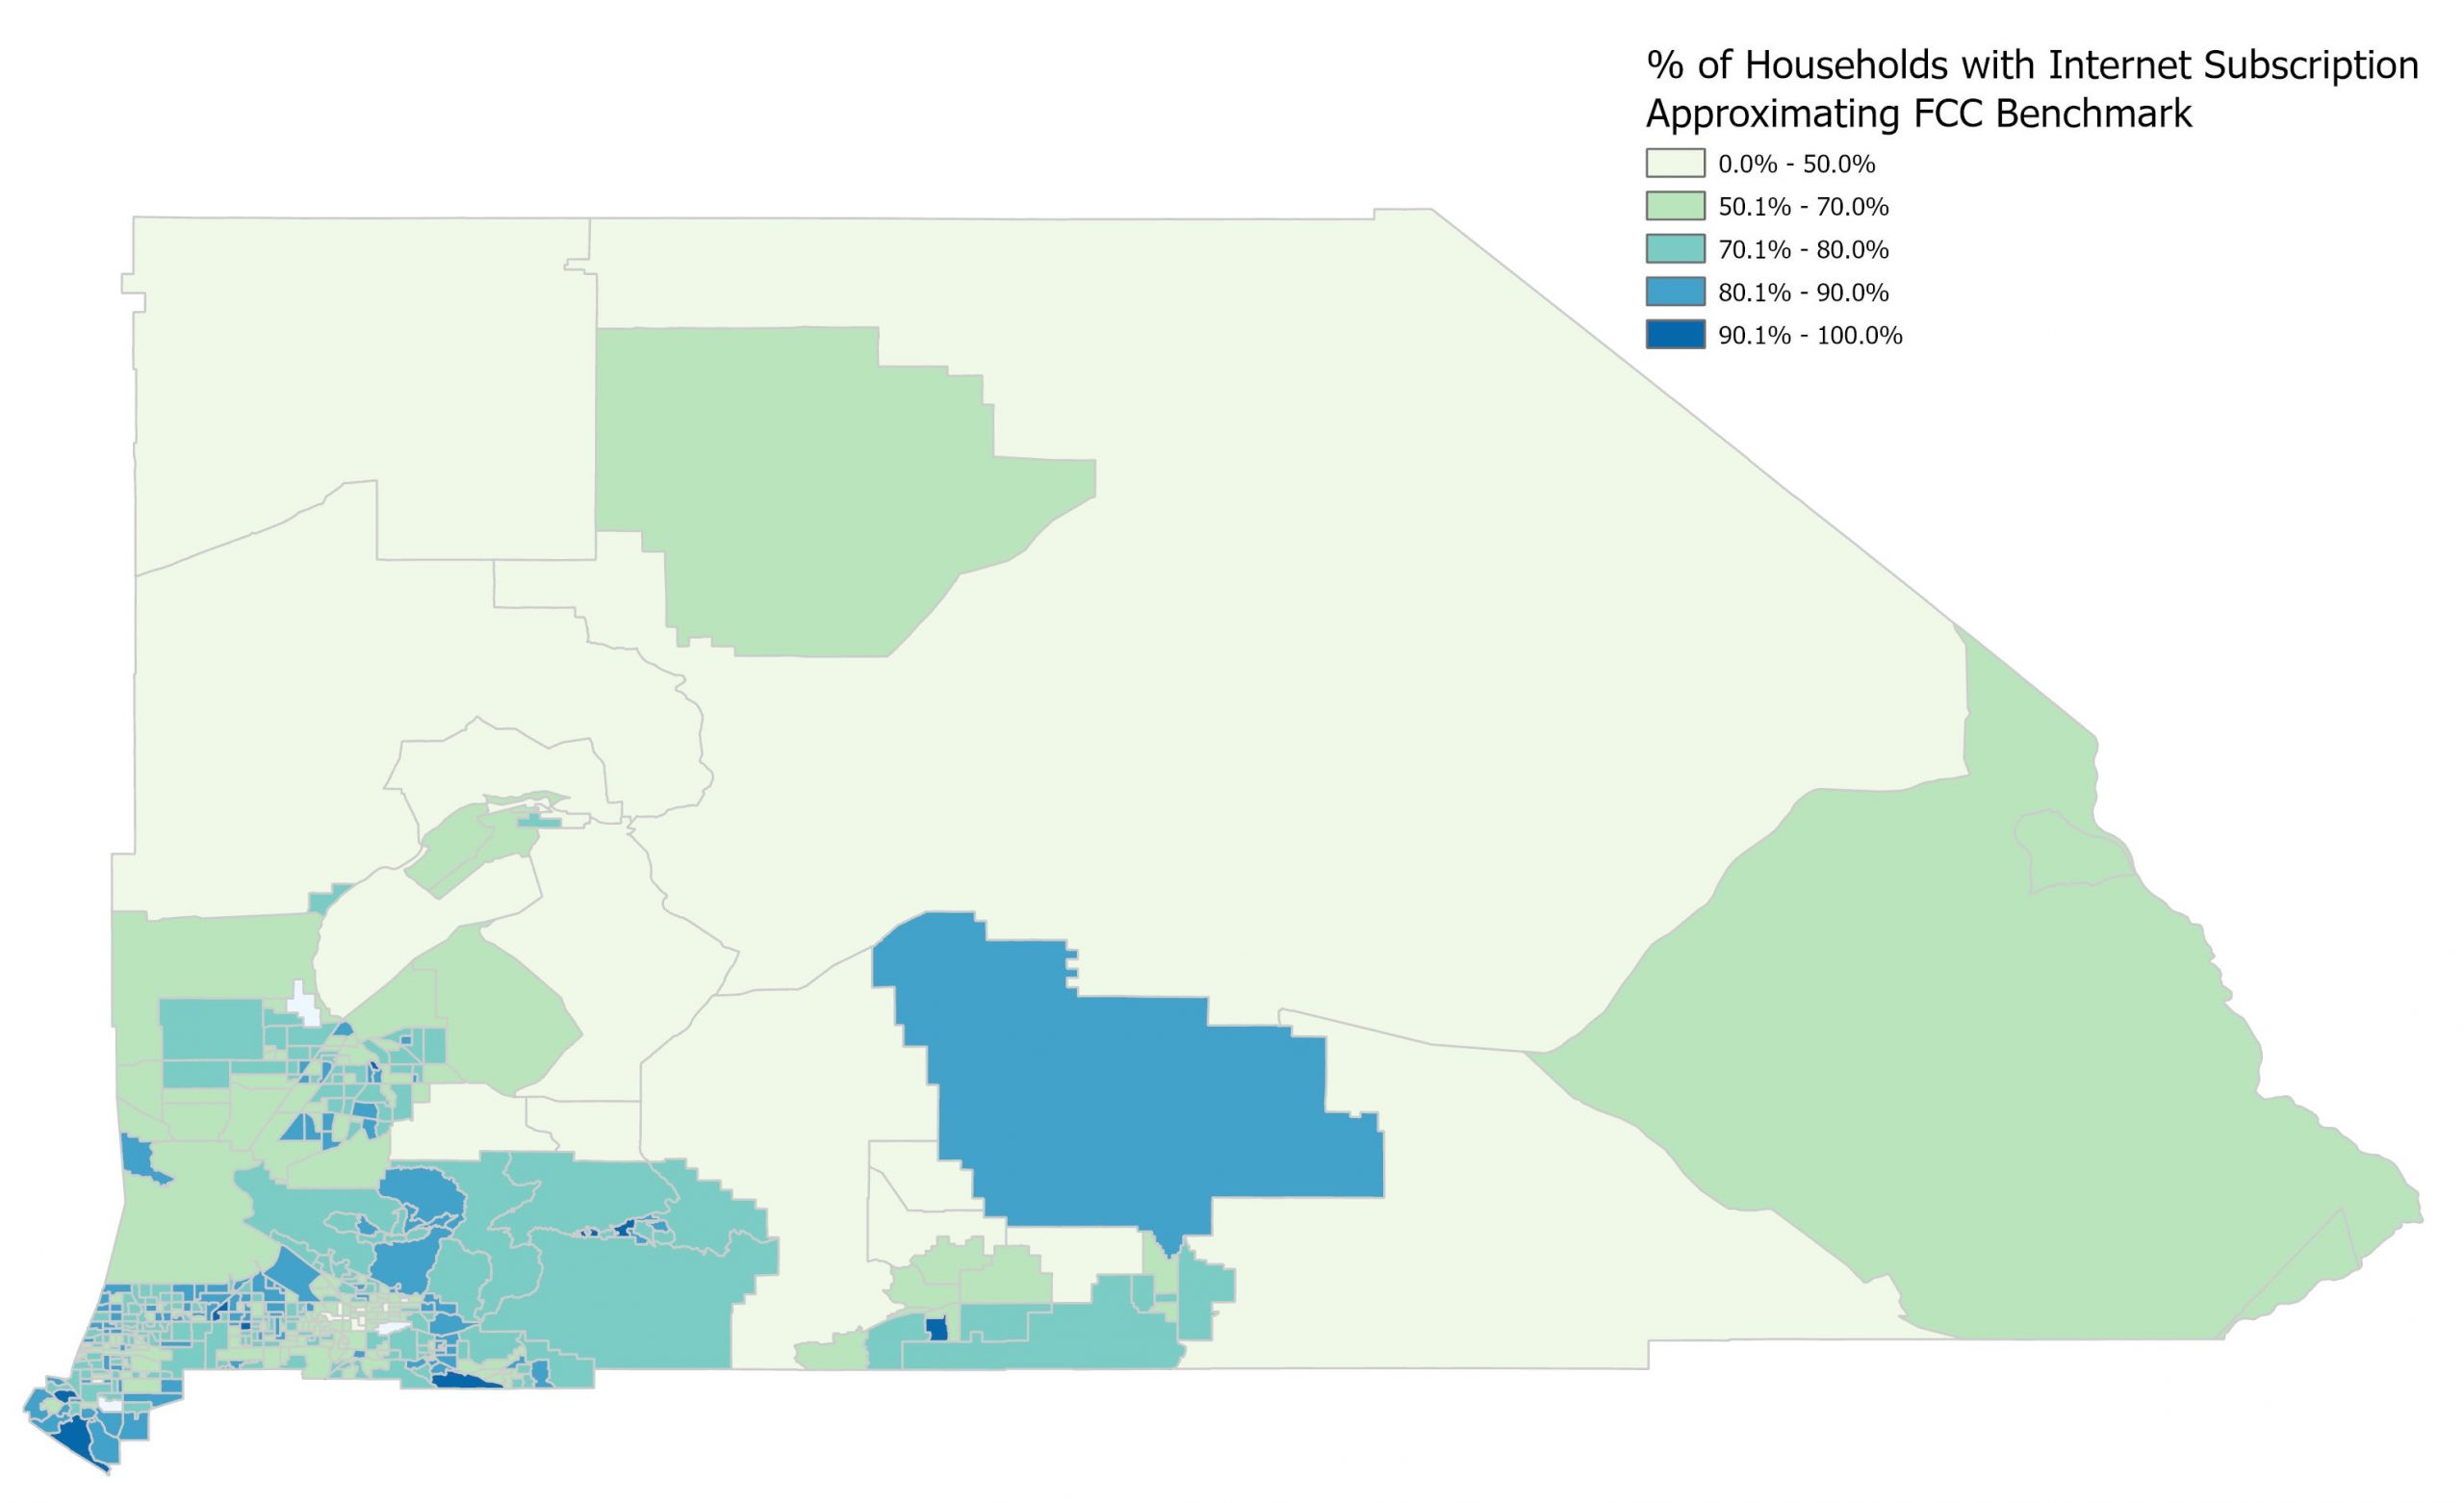
The map below displays the percentage of households within each census tract in the county that have a subscription to Internet service that approximates the FCC benchmark. No census tract had 100% of households subscribed at this level of service; the highest rate was 92.1%. The darkest shade on the map indicates rates of Internet adoption exceeding 90%. Census tracts that are the lightest shade on the map have Internet adoption rates ranging from a low of 16.5% of households to 50% of households.
INTERNET ADOPTION APPROXIMATING THE FCC BENCHMARK RANGES FROM 16.5% TO 92.1% OF HOUSEHOLDS
Percentage of Households with an Internet Subscription Approximating the FCC Benchmark by Census Tract in San Bernardino County, 2024
Source: U.S. Census Bureau, American Community Survey, 2024 5-Year Estimates, Table S2801
Broadband Desert Index
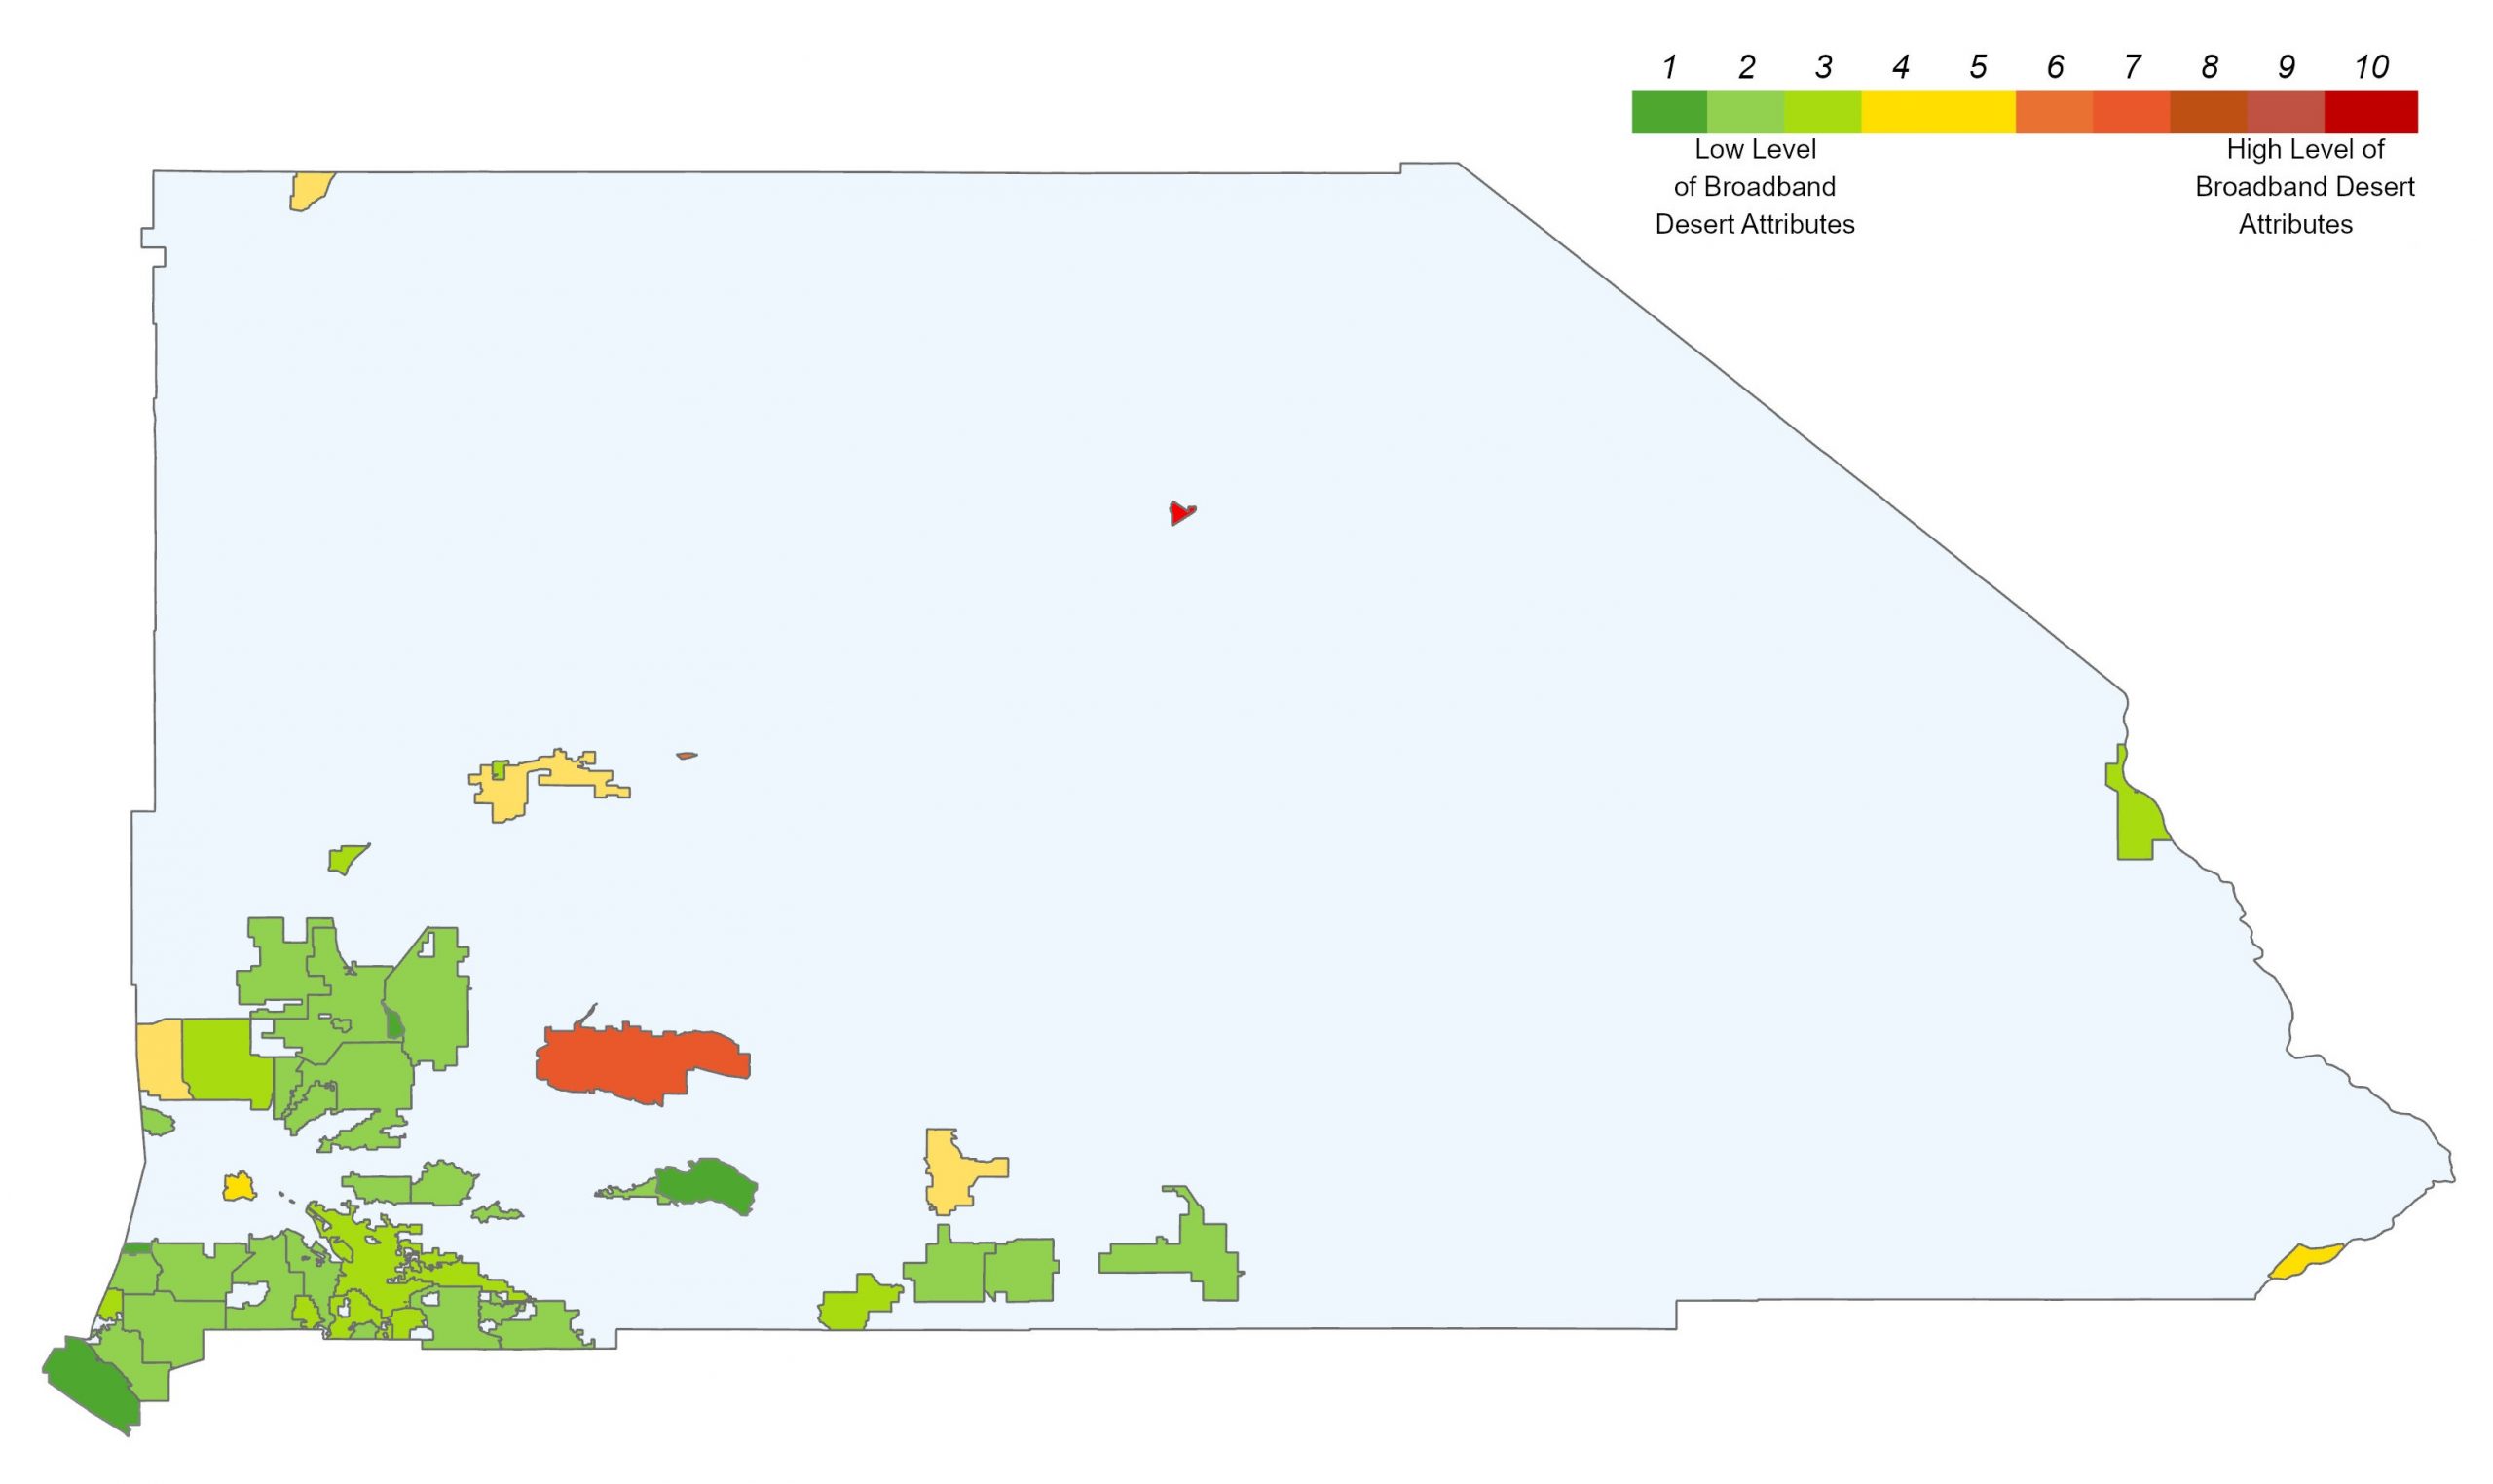
The term “broadband desert” or “digital desert” is commonly used to describe areas that are unserved by affordable, high-speed, and reliable broadband service. For many broadband deserts, the only options are spotty cellular connections to a mobile device or costly satellite service, which require both high upfront and monthly costs. When an area with poor connectivity also has high rates of poverty, the burden is compounded and can lead to low Internet subscription rates. The Broadband Desert Index was created expressly for the Community Indicators Report to approximate cities and major unincorporated communities in the county that have broadband desert attributes. It combines the availability and adoption measures shown in this indicator along with the addition of a measure of poverty.[3] A value of 10 on the index indicates the most severe broadband desert attributes, while a value of 1 on the index the least severe broadband desert attributes.
In San Bernardino County, the unincorporated communities of Baker (approximately 200 households) and Lucerne Valley (approximately 2,200 households) have the most severe broadband desert attributes. In Baker, which had a poverty rate of 28.4% in 2024, two-thirds (66.2%) of residential buildings do not have the ability to subscribe to terrestrial Internet at speeds of at least 100/20 Mbps (the FCC benchmark). This lack of high-speed, non-satellite Internet likely contributes to the fact that 25.3% of households do not have an Internet subscription and, among those that do, 32.5% opt for costly satellite service. It also contributes to approximately one-third of Baker households (34.5%) having only a cellular data plan and no other type of Internet service. Taken in aggregate, these rates return an index value of 10 – the highest value on the scale.
The next highest index value was 7, which applied to Lucerne Valley, where the poverty rate was 21.9% in 2024. Over half (50.8%) of residential buildings in Lucerne Valley do not have terrestrial Internet capacity at or above the FCC benchmark speed. Consequently, 18.2% of households do not have an Internet subscription and, among those that do, 18.2% have satellite service. In Lucerne Valley, 28.8% of households rely on a cellular data plan as their sole means of accessing the Internet.
Additional communities that scored on the higher end of the index include Yermo (6), Big River (5), and Lytle Creek (5). Most cities and unincorporated communities (57%) scored a 1 (4 places) or 2 (24 places) on the index, which means these places have comparatively higher rates of high-speed Internet availability and adoption, and/or lower rates of poverty, satellite subscriptions, and cellular-only subscriptions.
BAKER, LUCERNE VALLEY, AND YERMO HAVE HIGHEST LEVELS OF BROADBAND DESERT ATTRIBUTES
Broadband Desert Index for San Bernardino County Cities and Major Unincorporated Areas, 2024 and 2025
Source: Parsons Consulting, Inc. analysis of data from Federal Communications Commission, National Broadband Map, June 30, 2025 (https://broadbandmap.fcc.gov/) and U.S. Census Bureau, American Community Survey, 5-Year Estimates, 2024, Tables S1701 and S2801
[1] For the broadband availability indicator, please note that the number of residential buildings is not equivalent to the number of units or households. For example, an apartment building with several units would be counted as one point of connectivity according to the FCC data. Conversely, American Community Survey adoption data is measured by household.
[2] Estimate of households with an Internet subscription that approximates the FCC benchmark is calculated by subtracting households with a mobile subscription and no other type of Internet access and households with a satellite subscription from households with any type of Internet subscription.
[3] The index includes the percentage of people in poverty (2024, ACS), households with satellite Internet service (2024, ACS), households with a cellular data plan and no other type of Internet subscription (2024, ACS), households without an Internet subscription (2024, ACS), and residential buildings without terrestrial Internet availability at speeds of at least 100/20 Mbps (June 2025, FCC). To emphasize the key measures of availability and adoption, the last two measures were weighted 0.5 more than the other three measures. Values for each measure for each geography were normalized to a value ranging from 1 to 10; these were summed (with the weighting, as described) and that sum was normalized to arrive at an index value of between 1 and 10. The value of 1 indicates the city or community has low levels of broadband desert attributes and value of 10 indicates the city or community has high levels of broadband desert attributes. The index is a descriptive analysis to visualize variation in characteristics related to broadband access and should not be used for official purposes. The unincorporated communities of Bluewater and Oak Glen were omitted from the index due to unstable data.