San Bernardino Metro Ranks Among Top 100 Best Performing Regions
A region’s attractiveness as a place to do business is critical in today’s interconnected national economy, where entrepreneurs and businesses have choices about where to locate.[1] The availability of business supports, opportunities for growth, and barriers to doing business are all factors influencing these choices. Since businesses provide jobs, sales tax revenue, economic growth, and entrepreneurship opportunities, a strong business climate and growing job base are important for maintaining San Bernardino County’s economic health and quality of life. This indicator uses two indices as proxies for assessing the county’s business climate: the Milken Institute’s “Best Performing Cities,” which is based on job creation, wage growth, and output growth; and the Economic Development Capacity Index (EDCI), which provides summative information related to human capital, financial, industry, infrastructure, and institutions and partnership capacity at the county level.[2]
TREND
Best Performing Regions
Based on the Milken Institute’s 2025 rankings of 200 metro areas, the Riverside-San Bernardino metro area ranks among the top 100 best performing regions in the nation, with an overall performance rank of 53rd out of 200.[3] Despite this achievement, the region’s overall performance has worsened, from a ranking of 22 in 2022. Additionally, the county’s ranking among selected components of the index has worsened from 2022, with the exception of 5-year Hi-Tech GDP, which improved from 57th to 49th, and Broadband Access, which improved from 61st to 55th position. In 2025, Riverside-San Bernardino ranked 31st in 5-year wage growth (2018-2023) and 34th in 5-year job growth (2018-2023). The region’s 2025 12-month job growth ranking was 168th, and the region ranked 151st in High-Tech Concentration.
RIVERSIDE-SAN BERNARDINO’S OVERALL BUSINESS PERFORMANCE RANKS 53RD AMONG LARGE U.S. METRO AREAS
Riverside-San Bernardino Metro Area Business Performance Rankings, 2025
| Indicator | Ranking (Out of 200 Metro Areas) |
|---|---|
| Overall rank | 53 |
| Wage Growth 2018-2023 | 31 |
| Job Growth 2018-2023 | 34 |
| 12-Month Job Growth | 43 |
| High Tech GDP 2018-2023 | 49 |
| Broadband Access 2023 | 55 |
| High Tech Concentration 2023 | 151 |
| Housing Affordability 2023 | 188 |
Source: Milken Institute, Best Performing Cities 2025 (https://milkeninstitute.org/content-hub/research-and-reports/research-and-data-tools/2025-best-performing-cities-mapping-economic-growth-across-us)
ECONOMIC DEVELOPMENT CAPACITY INDEX EXPLAINED
The Economic Development Capacity Index (EDCI) assesses five key domains:
- Human Capital: The overall composition of the workforce and quality of life for all residents in a county.
- Financial Capital: The financial environment within a county, including the accessibility of public sector capital funds to the private sector and the relative health of local government finances.
- Industry Capital: The business environment within a county, including the presence of local employment and establishment clusters, industry diversity, business entrance and exit rates, and the presence of industries.
- Infrastructure Capital: The physical and environmental resources that make economic development activities possible and support quality of life, including transportation, ports, energy reliability, broadband, land or water quality, and amenities.
- Institutions and Partnership Capacity: The public and private entities that support and facilitate economic development, entrepreneurship, and innovation through collaborative networks.
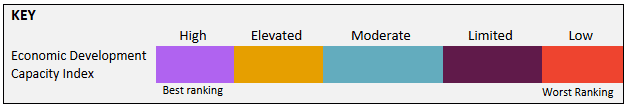
EDCI quantitative indicator scores within each capacity category are standardized into percentiles which are assigned one of five qualitative categories based on national data.
- Low capacity is well below the national average.
- Limited capacity is slightly below or approaching the national average.
- Moderate capacity is close the the national average.
- Elevated capacity is above the national average.
- High capacity is well above the national average.
For more information on the EDCI, please visit: https://diseoportal.egs.anl.gov/EDCI/
BASELINE
Economic Development Capacity Index
San Bernardino County’s EDCI human capital capacity is limited compared to the national average. The remaining EDCI categories of financial, infrastructure, industry, and institutions and partnership are moderate, or close to the national average.
SAN BERNARDINO COUNTY CLOSE TO NATIONAL AVERAGE ON ECONOMIC DEVELOPMENT CAPACITY
San Bernardino County Qualitative Score for Each Economic Development Capacity Category Compared to National Average, 2024
| Economic Development Capacity Domain | Capacity Status |
|---|---|
| Human Capital | Limited |
| Financial | Moderate |
| Infrastructure | Moderate |
| Industry | Moderate |
| Institutions and Partnerships | Moderate |
Source: Economic Development Capacity Index, 2024
GEOGRAPHIC COMPARISON
Best Performing Regions
At 53rd in the nation, the Riverside-San Bernardino metro area ranked behind the Phoenix metro area (23rd) and Las Vegas metro area (34th), but above the other selected peer markets based on business performance.
RIVERSIDE-SAN BERNARDINO METRO RANKS THIRD AMONG PEER REGIONS
Overall Business Performance Ranking Among Riverside-San Bernardino and Peer Markets, 2025
| Metro Region | Ranking (Out of 200 Metro Areas) |
|---|---|
| Phoenix Metro | 23 |
| Las Vegas Metro | 34 |
| Riverside-San Bernardino Metro | 53 |
| Miami Metro | 64 |
| San Diego Metro | 71 |
| Orange County | 113 |
| Los Angeles County | 151 |
Source: Milken Institute, Best Performing Cities 2025 (https://milkeninstitute.org/content-hub/research-and-reports/research-and-data-tools/2025-best-performing-cities-mapping-economic-growth-across-us)
Economic Development Capacity Index
Compared to peer counties, San Bernardino measured lower than most peer communities on financial, infrastructure, and industry capacity. It measured similar to Los Angeles and Miami-Dade, but behind Orange, San Diego, and Maricopa counties on human capital capacity, and near national average on institutions and partnership capacity, ahead of both Miami-Dade County and Maricopa County.
SAN BERNARDINO LAGS PEER COUNTIES IN INFRASTRUCTURE AND INDUSTRY CAPACITY MEASURES
San Bernardino and Peer Counties Qualitative Score for Each Economic Development Capacity Category Compared to National Average, 2024
| San Bernardino County | Los Angeles County | Miami-Dade County | Orange County | San Diego County | Maricopa County | Clark County | |
|---|---|---|---|---|---|---|---|
| Human Capital | Limited | Limited | Limited | Elevated | Elevated | Elevated | Limited |
| Financial | Moderate | High | High | High | High | High | Moderate |
| Infrastructure | Moderate | Elevated | High | Elevated | High | High | High |
| Industry | Moderate | Moderate | High | Elevated | Elevated | High | High |
| Institutions and Partnerships | Moderate | Moderate | Limited | Moderate | Moderate | Low | Moderate |
Source: Economic Development Capacity Index, 2024
[1] Global trade discussions at the start of 2025 may impact business climate metrics and are not represented in currently existing data.
[2] Data are sourced from Milken Institute’s Best Performing Cities 2025 and the Economic Development Capacity Index 2025 reports.
[3] Milken Institute’s Best Performing Cities 2025 rankings are based on 2018-2023 growth estimates and 2024 labor market metrics.